
The short answer
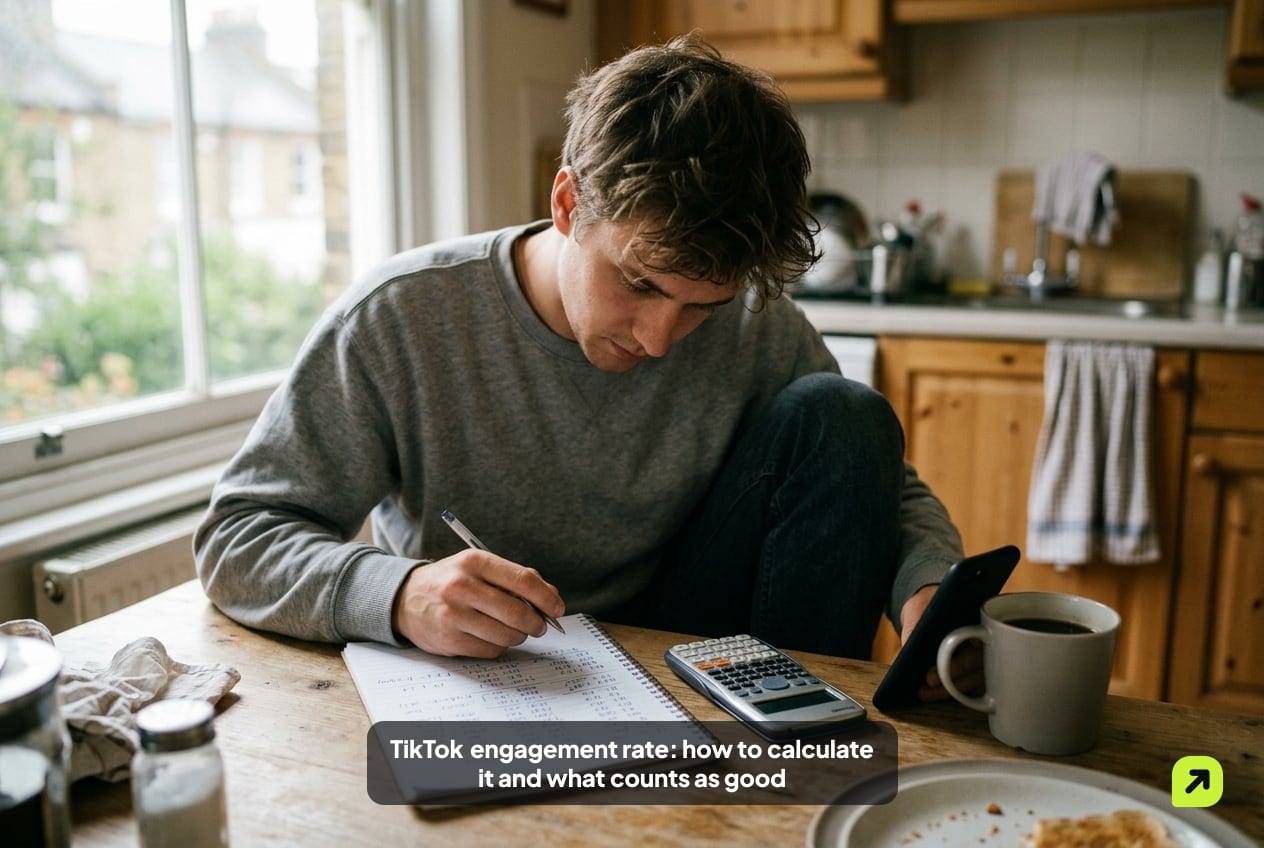
TikTok engagement rate is interactions divided by views, or by followers, times 100. By views, add likes, comments, shares and saves, divide by video views and multiply by 100. Socialinsider's 2025 data puts the average near 4% by views; Quid's 2026 brand median is 2.01% by followers.
Key facts
- Socialinsider measures TikTok engagement by views: likes, comments, shares and saves divided by views. It reports 4.20% for 2025, and 3.75% to 4.40% across five follower tiers.
- Quid's 2026 benchmark report (published March 5, 2026) divides interactions by follower count and found a median TikTok engagement rate of 2.01%.
- TikTok says neither follower count nor previous high-performing videos are direct factors in For You recommendations, which is why a by-views rate fits TikTok better than a by-followers one.
- In our worked example, one video scores 6.68% by views and 4.60% by followers; a viral one scores 5.13% by views but 68.39% by followers.
- TikTok's Community Guidelines, effective September 24, 2026, bar the trade of services that artificially boost engagement or trick the recommendation system.
You post a video, it gets 8,000 views and 400 likes, and now you want to know if that is any good. The answer depends on which formula you use. Two people can look at the same video and report 5% and 2.2%, and both can be correct.
This guide gives you the four formulas, tells you which number in TikTok’s analytics goes in each, works the arithmetic on real-looking videos, and sets the result against 2026 benchmarks that say where they came from. If you want the arithmetic done for you, use the TikTok engagement rate calculator. For the cross-platform view, read what is a good engagement rate.
What is the formula for TikTok engagement rate?
Interactions divided by an audience number, times 100. The interactions are the same in every version: likes, comments, shares and saves. What changes is the number underneath.
Socialinsider, whose TikTok benchmarks are among the most quoted, defines engagement rate by views as the total interactions on posts (likes, comments, shares and saves) divided by the views gained, times 100. Quid, which publishes the other widely cited report, says its engagement rate is total interactions divided by follower count.
Neither of these comes from TikTok itself. In the help pages we checked, TikTok does not define an engagement rate, so there is no official one to match. That is why you should always write down which formula you used.
Which TikTok engagement rate formula should you use?
Here are the four, with what each is for.
| Formula | Calculation | Use it for | Weak spot |
|---|---|---|---|
| By views | (likes + comments + shares + saves) ÷ views × 100 | Judging a single video | Replays can inflate views |
| By followers | (likes + comments + shares + saves) ÷ followers × 100 | Media kits, brand briefs, comparing accounts | Swings wildly when a video reaches non-followers |
| By reach | Interactions ÷ unique people reached × 100 | Instagram-style reporting | We found no per-video unique reach figure in TikTok’s help pages; use views instead |
| Weighted by views | (likes + 2 × comments + 3 × shares + 2 × saves) ÷ views × 100 | Telling a video people kept from one they only liked | The weights are your own convention, not TikTok’s |
The first two do nearly all the work. The reach version exists because Instagram reports reach, and creators carry the habit over. On TikTok, a view is the closest number you have: TikTok’s ads help center defines video views as the number of times a video started to play, and says replays are excluded from that count.
The weighted version is a tool of your own. Pick weights once, write them down and never change them mid-comparison, or your trend line means nothing.
Which TikTok analytics numbers go into each formula?
Open the analytics for a single video and note these. The names below are how creators describe them, and the labels in the app can shift between updates.
- Video views: the denominator for the by-views rate.
- Likes, comments, shares and saves: the four interactions. Add them.
- Followers: from your profile, on the day you post, for the by-followers rate.
- Average watch time: not part of the formula, but the first thing to read when the rate is low.
- Watched full video (finish rate): the share of viewers who watched to the end. A rate that is low alongside a poor finish rate usually points at the opening seconds, not the call to action.
TikTok’s ads help center defines average play time as the average time a video was played per user, including replays. That definition is for advertisers, so your in-app figure may be built a little differently. Use it as a trend, not an absolute.

How do you calculate it? A worked example
Take a creator with 18,000 followers and five recent videos. The numbers below are invented to show the arithmetic; they are not Socipro data or anyone’s real account.
| Video | Views | Likes | Comments | Shares | Saves | Interactions | By views | By followers |
|---|---|---|---|---|---|---|---|---|
| A | 3,200 | 150 | 12 | 14 | 14 | 190 | 5.94% | 1.06% |
| B | 12,400 | 620 | 38 | 74 | 96 | 828 | 6.68% | 4.60% |
| C | 5,100 | 205 | 9 | 18 | 23 | 255 | 5.00% | 1.42% |
| D | 240,000 | 9,100 | 410 | 1,300 | 1,500 | 12,310 | 5.13% | 68.39% |
| E | 1,900 | 62 | 4 | 6 | 8 | 80 | 4.21% | 0.44% |
Walk through video B. Interactions are 620 + 38 + 74 + 96 = 828. By views: 828 ÷ 12,400 × 100 = 6.68%. By followers: 828 ÷ 18,000 × 100 = 4.60%. Weighted by views: (620 + 2 × 38 + 3 × 74 + 2 × 96) ÷ 12,400 × 100 = 1,110 ÷ 12,400 × 100 = 8.95%.
Now look at video D. It went far beyond the account’s followers, and the by-followers column reads 68.39%, a number that says nothing about the audience. By views it is 5.13%, in line with the rest. That is the practical reason to judge TikTok videos by views.
To get one number for the account, use the median of the by-views column: sorted, the rates are 4.21%, 5.00%, 5.13%, 5.94% and 6.68%, so the median is 5.13%. The mean of the five rates is 5.39%. Pooling everything gives 13,663 interactions ÷ 262,600 views × 100 = 5.20%, but that is dominated by video D, which is why the median is steadier.
What is a good TikTok engagement rate in 2026?
Benchmarks only help when you match the formula. These are the two sources we checked today.
| Benchmark | Formula | Value | Period and sample |
|---|---|---|---|
| Socialinsider, all accounts | By views | 4.20% | 2025 |
| Socialinsider, 1K to 5K followers | By views | 4.40% | 2025 data |
| Socialinsider, 5K to 10K followers | By views | 4.00% | 2025 data |
| Socialinsider, 10K to 50K followers | By views | 3.90% | 2025 data |
| Socialinsider, 50K to 100K followers | By views | 3.75% | 2025 data |
| Socialinsider, 100K to 1M followers | By views | 3.95% | 2025 data |
| Quid, all industries | By followers | 2.01% median | Report dated Mar 5, 2026; 150 random companies per industry |
A few honest notes. Socialinsider’s page contains inconsistencies. It labels some figures as 2026 that it describes as 2025 values, and the 3.85% figure appears under both 2024 and the first half of 2026. We use only the 2025 per-tier numbers, which are internally consistent. The Quid report samples company accounts, not individual creators.
So a working target: around 4% by views is typical, a rate of 6% or higher is strong, and below 3% suggests viewers are watching without reacting. Those thresholds are our reading of the benchmark spread, not a rule. Your own median over the last month is the better yardstick. For the same comparison on the other platform, see the Instagram engagement rate guide.
Why do by-views rates run higher than by-followers rates?
Because the denominators are not the same size. A creator with 18,000 followers who averages 6,000 views per video divides by a number one third as large when using views. The by-views rate will be higher whenever views are below your follower count, and lower than it would seem whenever a video travels past it.
It also runs the other way on a successful video. Video D above has 240,000 views against 18,000 followers, so the by-followers rate leaps while the by-views rate stays flat.
Neither is wrong. By followers answers “how engaged is my existing audience on average”; by views answers “how did the people who watched react”. TikTok recommends videos to people based on their own activity, and its newsroom says plainly that neither follower count nor previous high-performing videos are direct factors, so the second question is the one the platform itself keeps asking. Our guide to how the TikTok algorithm works goes through the signals.
What drives TikTok engagement rate up or down?
Four things move it most.
- Where the views come from. A video shown to strangers is watched by people who have no history with you. They react less often than followers. A wider reach nearly always means a lower per-view rate.
- Retention. Viewers who leave in the first seconds rarely interact. Check average watch time and the finish rate before you rewrite a caption.
- Interaction mix. Saves and shares need a reason: a recipe, a checklist, something to send to a friend. TikTok saves vs shares explains which one to aim for.
- Views that never get going. A video stuck at a few hundred views has a tiny denominator, so a handful of likes can make the rate look huge or tiny. If that is your situation, read why TikTok views get stuck at 200 first.

How do you track your rate month to month?
Keep it simple. Once a month, take the last 10 to 15 videos, drop promoted ones, and compute the by-views rate for each. Record the median, the number of videos and your follower count that day. That is a three-column sheet.
Then compare the median with last month’s, not with a published average. A drift from 4.8% to 4.1% over two months is a signal worth acting on, whatever the benchmark says. A single dip after a viral video is not.
If a new video needs visible reactions in its first hour, you can buy TikTok likes as a starting push or add TikTok views to give a launch a bigger first audience. Count those videos separately and leave them out of your median, so the number still measures how your own viewers react. TikTok’s Community Guidelines, effective September 24, 2026, do not allow trading services that artificially boost engagement or trick the recommendation system, and TikTok says it will remove fake likes and followers, so go in aware that the risk is yours. For creators in the United States, our US page covers ordering and payment details.
Sources
Frequently asked questions
Is a 5% engagement rate good on TikTok?
Does TikTok show engagement rate in its analytics?
Should I use views or followers for TikTok engagement rate?
Why is my engagement rate lower on my most viewed video?
Do shares count more than likes in the engagement rate?
How many videos should I average for a reliable rate?
Can buying likes improve my TikTok engagement rate?
 Oliver AshfordEditor, YouTube, X and Buying GuidesOliver Ashford edits Socipro's YouTube, X and buying guides. The YouTube guides cover how views and subscribers are counted, why counts sometimes get corrected, and what the YouTube Partner Program asks for. The X guides cover followers, reposts and how the trending list works. The buying guides explain what to check before paying any growth service, Socipro included: refill terms, refund rules and what the seller needs from you.
Socipro sells the services mentioned in this article. How we write and check our guides: editorial policy.